14 December 2010

Solar system estimated output using RETScreen.net

RETScreen.net was used to estimate the amount of radiation received on the solar panels to estimate the yield we could expect for our systems. Here are the main input parameters:

  • 4.9 kW of panels [20 panels that are 245 Solarworld panels
  • 135 deg azimuth
  • 40 deg slope on panels
  • Guelph
  •  5.0 kW inverter
The revenue would be the total annual 6.140 MWhrs at $802. Using 3.5% interest rate and a 10 year loan the system has a calculated simple payback of 6.9 years. Net revenue after 10 years is $9,000 and after 20 years is $55,000.
Month
Daily solar radiation - horizontal
Daily solar radiation - tilted
Electricity export rate
Electricity exported to grid

kWh/m²/d
kWh/m²/d
$/MWh
MWh
January
1.67
2.74
802.0
0.375
February
2.84
4.13
802.0
0.505
March
3.70
4.40
802.0
0.584
April
4.53
4.64
802.0
0.580
May
5.63
5.30
802.0
0.667
June
6.31
5.74
802.0
0.682
July
6.13
5.66
802.0
0.687
August
5.28
5.24
802.0
0.637
September
3.88
4.24
802.0
0.509
October
2.59
3.24
802.0
0.415
November
1.36
1.81
802.0
0.234
December
1.25
1.94
802.0
0.264
Annual
3.77
4.09
802.00
6.140

I shall be comparing this with PVWatts in the coming days.

10 December 2010

Production summary - daily from 25 Sept 2010 to 10 Dec 2010

There is considerable variability of daily power production. The following chart shows the daily revenue [at $0.802/kWhr]. The chart points are the daily values, the solid horizontal line is the daily revenue required to break even on the 10 year loan payment. Generally the system has been earning more than it has cost, though the time frame has been too short to give a proper assessment. Note the last couple of days in November are clustered around $1. This was caused by several days of continuous full or partial snow cover. This chart will be updated approximately monthly.

Production summary - monthly from 25 Sept 2010 to 10 Dec 2010

This is a summary of the generation from our system from 25 Sept to 09 Dec. I shall be comparing these stats with RETScreen.net and posting that info in the coming days. October was our best month, the last few days in November were very dark, cloudy, and several days with snow cover on the panels. The first 9 days saw several days with partial snow cover on the panels. At this rate the panels would yield approximately $150 in Dec. [we need $332 to break even].
Monthly Stats    kWhr    Rev
2010-08    141    $113.08
2010-09    450    $360.90
2010-10    457    $366.51
2010-11    355    $285.01
2010-12-09    62    $49.45

01 December 2010

Enphase micro-inverter projects

Micro-inverters are an alternative to string inverters. Inverters convert the DC power from the panels to AC. A micro-inverter is wired to one panel, so you have as many inverters as panels. A string inverter has all the panels wired to it - only one inverter is converting the DC to AC power. Everyone has an opinion on which is better, especially sales people. I won't enter that debate now.
The purpose of this entry is to provide a link to a solar company website with solar PV sysetems with Enphase micro-inverters installed here in Ontario. Sentinel Solar has six projects listed on their website. [Oddly enough, when looking at each system some seem to be installed by different solar companies, not necessarily by Sentinel. Nothing like advertising for your competitors]. You will notice some things about these systems:
  • the Enphase micro-inverters provide panel-specific monitoring - interesting to see the variability between the panels
  • the web monitoring is nice if you are curious about instantaneous and historical power production
  • you can see the difference between the various systems all in one spot
  • you can't compare one system against another as some are roof mounted, others are trackers, and the panels are likely different at each location
  • individual panel monitoring can help you understand the power production, however if you see the inherent differences between the panels it is quite likely you won't be doing much about it. It might just drive you crazy wondering why
Keep in mind, we don't see the costs of the different systems. Monitoring and power generation is interesting, but installation and maintenance costs are also part of the equation!

Nov 2010 results, how much energy are the panels producing

It is very difficult to determine what size panels and inverter to get. One option is to slightly oversize your panel wattage output compared to your inverter capacity. For example, installing 20 panels of 235 kW gives you a theoretical maximum of 4.7kW output from the panels. Installing a 4 kW inverter means your panels are over-sized for the inverter by 18%. I have heard that solar installers often will "oversize" the panel array for the inverter by 10%-20%. The logic is that you can save a little money by buying a smaller inverter because the likelihood of the system frequently producing maximum power is low. Also, inverters are often most efficient when operating towards their top end of output. Therefore, installing an over powered inverter means it may be operating at less than its maximum efficiency - and that is an power conversion loss to you.
Another reason why panels will be over-sized is for people installing a 10 kW array. The microFIT program limits you to 10 kW of either panels or inverter, whichever is the lowest rated output. Therefore, the system would install 10% or more watts of panels of the inverter capacity - to maximize the amount of energy generation in the mornings, afternoons, and cloudy days. You pay a little more for the panels, but in the long run you make more power under suboptimal radiation periods. And the project would still qualify as a =<10 kW project for the microFIT rules.
My situation was a little different. At first I was going to have 20 235 W panels, however, I eventually had 20 245 W panels installed, and I had a 4 kW inverter. Instead of my panel array being over-sized by 18% it was now 23%. I had no reliable way to assess if I would have a significant power generation loss over the year with an inverter that could now be notably undersized. Additionally, when I ran the Fronius configuration tool [online version] my panel voltages were now going to exceed the inverter optimal ranges under certain temperature regimes. My solar installing company graciously switched my inverter to a 5 kW Fronius IG 5100. My inverter is now a little over-sized for my 4.9 kW system, but I am pleased that I'll not be losing power generation during peak radiation periods.
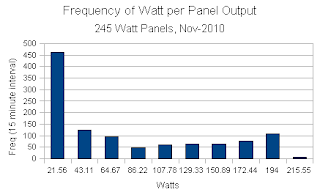
So... during a relatively cloudy, cool November, how much energy do my panels produce? I downloaded the entire month, except today's data [a very dark rainy day] and calculated the per panel 15 minute average power generation in watts.
Some stats:
  • there were 1103 15-minute measurement intervals from 1-29 Nov [will be higher in the summer when the sun is up longer]
  • the cloudy mornings, afternoons, and other very dark periods meant that quite often the average panel output was less than 21.5 W [that's less than 10% of the panel capacity]
  • maximum output was 215.5 W, there were only 7 15 minute periods where power was greater than 194 watts
  • maximum total output was 4311 W, this is somewhat low as higher values have been recorded in August and September
 I'll publish similar results for the forthcoming months.